Audience engagements across all digital channels presented in a radio-friendly format, including by show
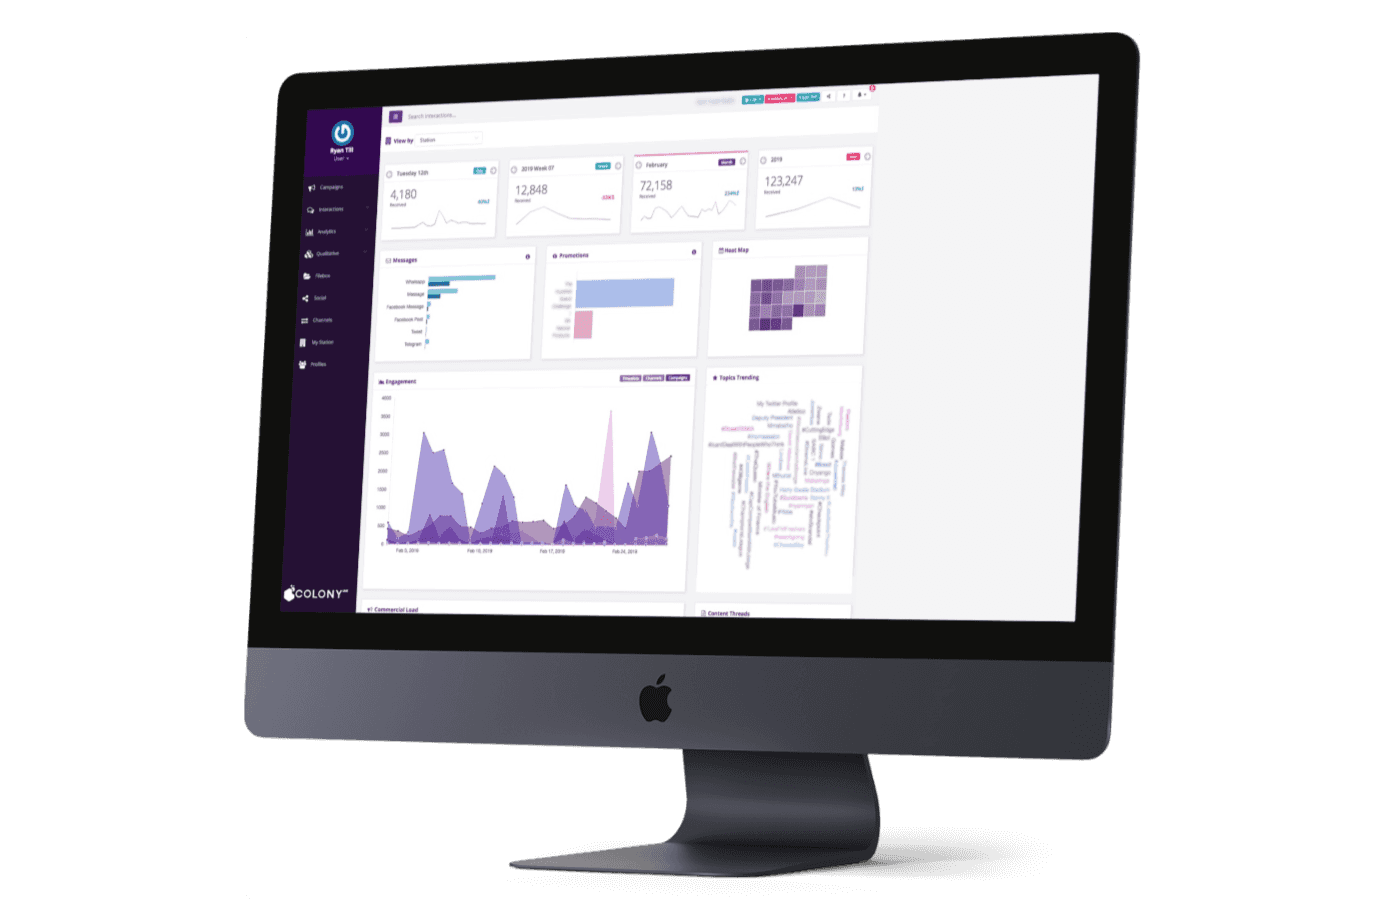
COLONYLive Programming Dashboard presents all your listener engagements so you can understand what’s driving your audience. See data by show, and compare across time periods like day, month, week and year. Get insights into metrics about what content is driving engagements.
Programming Dashboard
Data is presented in an easy-to-view format of graphs and charts. It enables radio programme managers to get insight into the live metrics showing what’s driving engagement on their station. The Programming Dashboard also allows comparison of engagement levels between shows, and specialist shows.